

Mortgage rates remain unchanged for another week as major lenders set their offerings in line with previous levels following two consecutive days of stability.
What to Know
- The 2026 HousingWire forecast projected mortgage rates between 5.75% and 6.75%, contingent on the 10-year yield holding near 5.35%.
- A primary forecast expects the average 30-year fixed rate to reach approximately 6.05% in 2027, though rates could return to 7% amid high inflation.
- Recent stabilization of the 10-year yield near 5.13% has paused rate increases, yet persistent inflation continues to pressure market conditions.
Market Snapshot: Mortgage Rates Stabilize Following Two-Month Volatility
Mortgage rates held steady on Wednesday, October 28, 2026, as major lenders set their morning offerings in line with the previous day’s levels following two consecutive days of stability. This pause marks a shift from early October, when rates had risen into the 7% range for the first time that year before dipping for the first time in two months. The stabilization coincides with the 10-year U.S. Treasury yield slipping from 5.24% to roughly 5.13%, allowing bond market volatility to subside after a period of investor caution regarding geopolitical conflicts and unemployment data.
The October 28 Rate Baseline: What Borrowers See Today
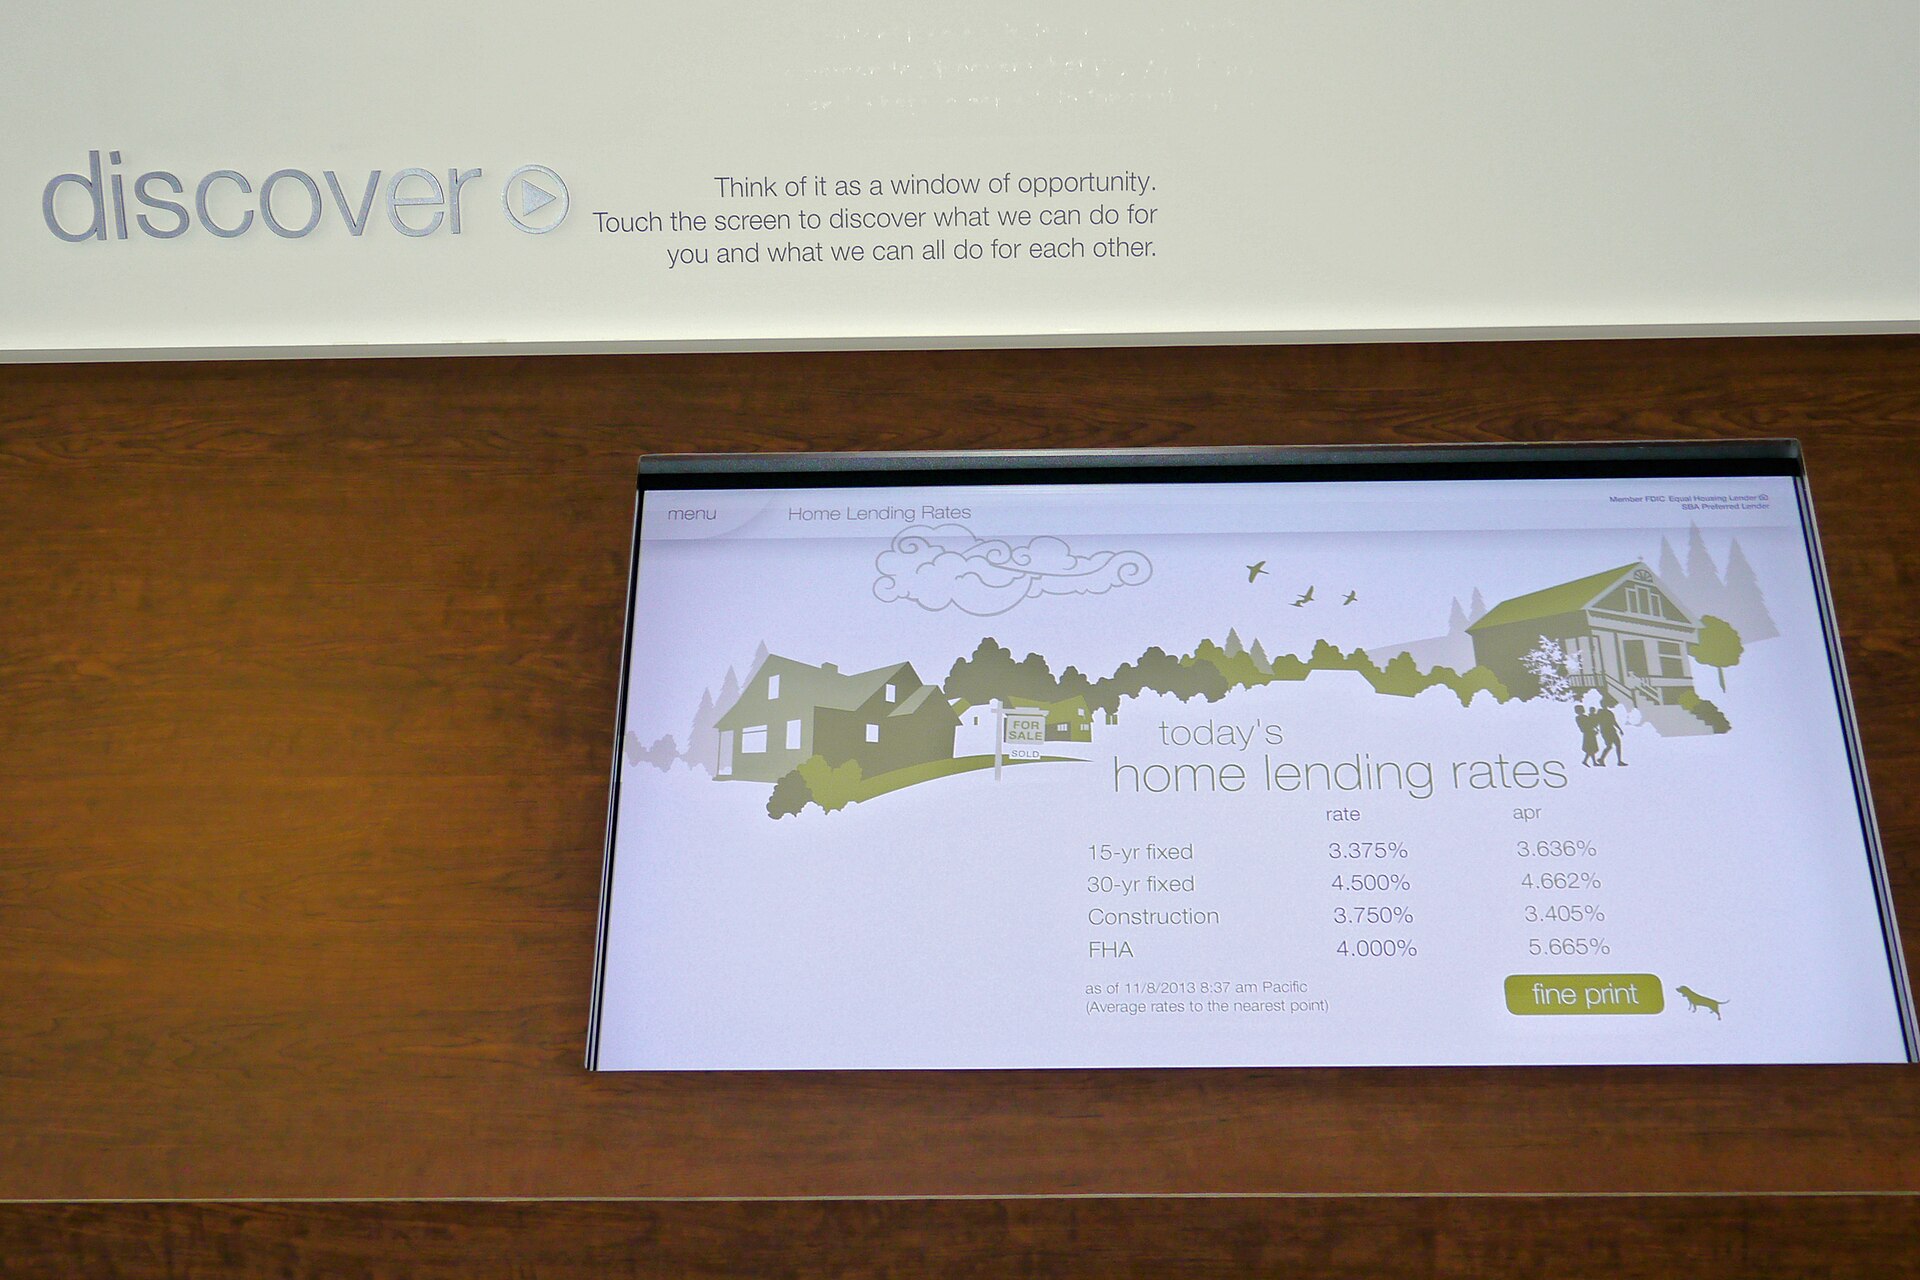
Data collected on Wednesday, October 28, 2026, shows the average 30-year fixed mortgage rate at 6.490% with an annual percentage rate of 6.702%, according to Bankrate. The same reporting period indicated a 5-year adjustable-rate mortgage (ARM) rate of 5.875% paired with an APR of 6.530%. These figures represent the current national averages for single-family home loans and reflect the immediate market conditions where lenders have maintained consistency rather than adjusting rates upward or downward.
This current baseline stands in contrast to data from July 5, 2025, when Zillow reported a 30-year fixed rate of 6.59% and a 15-year fixed rate of 5.81%. While the July figures showed small increases at that time, the October 2026 environment reflects a market where rates have dipped from their recent highs rather than continuing an upward trajectory. The current stability offers borrowers predictable monthly payments without the immediate pressure of rising interest costs seen during the preceding weeks.
From July Peaks to October Lows: A Timeline of the Shift
The transition from the volatility observed in early 2026 to the calm on October 28 involves a specific sequence of market movements where rates dipped below the 7% threshold after seven consecutive weeks of gains. After seven consecutive weeks of gains that pushed rates toward three-year highs, the bond market took a breather, leading to the recent dip below the 7% threshold. Investors have shifted to a defensive posture, waiting for fresh unemployment claims and monitoring ongoing conflicts before making further moves.
The current pause in rate increases is directly linked to the Treasury yield stabilizing after its decline from 5.24%. This shift has reduced the upward pressure on mortgage costs that characterized the earlier part of the year. While rates remain higher than levels seen during the height of the pandemic, the market has moved away from the fear of reaching 8% and is currently operating within a narrower range defined by recent yield performance.
While the October 28 baseline highlights stability, the specific composition of loan products available on that date reveals distinct pricing tiers between fixed and adjustable structures. Bankrate data for the same period indicates that while the 30-year fixed rate sat at 6.490% with an APR of 6.702%, the 5-year ARM offered a significantly lower initial rate of 5.875% paired with an APR of 6.530%. This spread illustrates the market’s current pricing strategy, where adjustable-rate mortgages provide a lower entry point for borrowers willing to accept future rate adjustments after their initial fixed period expires.
The financial implications of these rates are quantifiable in monthly payment estimates provided by lender data on October 28. For a standard loan scenario, the 30-year fixed mortgage at 6.490% corresponds to an estimated monthly principal and interest payment of $4,748, with upfront costs averaging $16,336 including points. In contrast, the 5-year ARM at 5.875% yields a lower monthly obligation of $4,448, though it carries slightly different upfront cost structures totaling approximately $15,381. These figures underscore that while the fixed rate offers long-term predictability, the adjustable option provides immediate cash flow relief for borrowers who may plan to refinance or sell before the initial period concludes. (Mortgage and refinance interest rates today, July 5, 2025: Rates hold steady)
The market’s defensive posture on October 27 and 28 was further reinforced by the anticipation of Federal Reserve policy announcements. Mortgage News Daily noted that while a Fed rate hike was deemed highly unlikely, the volatility typically associated with such events remained a potential disruptor due to the specific wording in the policy statement or comments from Chair Powell during the subsequent press conference. This uncertainty contributed to the bond market’s decision to remain flat for two consecutive days, as investors awaited clarity on whether the central bank would signal further tightening or maintain its current trajectory amidst geopolitical tensions and unemployment data.
The broader context of this stabilization involves a shift from the fear of rates reaching 8% to a more contained range defined by the 10-year Treasury yield’s performance. As noted in market analysis, the yield slipping from 5.24% to roughly 5.13% removed the upward pressure that had characterized early October, allowing mortgage rates to dip below the 7% threshold for the first time in two months. This correction followed a period of seven consecutive weeks where rates had climbed toward three-year highs, driven by investor caution regarding conflicts and economic indicators. The current environment suggests that while rates remain elevated compared to pandemic-era lows, the market has found a temporary equilibrium that offers borrowers more predictable payment structures without the immediate threat of further increases.
The Treasury Yield Anchor: How Bond Market Stability Drove the Pause
The recent stabilization in mortgage pricing stems directly from a pause in the 10-year U.S. Treasury yield, which slipped from 5.24% to roughly 5.13% last week. This movement occurred as investors adopted a defensive posture regarding ongoing geopolitical conflicts and awaited fresh unemployment data before adjusting their positions. The resulting shift allowed mortgage rates to dip slightly after peaking around 7.60%, temporarily halting the decline in housing demand that had characterized earlier weeks.

Mortgage spreads widened to 2.23% last week, an increase from 2.21% the prior week as yields moved lower, though these levels remain near cycle lows compared to previous years. This widening is a standard market reaction to limit volatility when bond yields shift sharply, though the source does not explicitly state this as the design purpose. Without this spread adjustment, the counterfactual scenario suggests mortgage rates would have reached 8.21% last week had spreads remained at their worst 2023 levels rather than the current 7.33%. Consequently, concerns regarding rates reaching 8% or higher have subsided as long as the yield holds near the 5% threshold.
Housing demand historically grows when mortgage rates remain under 6.64%, whereas rates above 7% have consistently produced softer market data over the last three years and ten months. While the current pause in yields has provided relief, the market remains sensitive to these higher rate environments that continue to suppress activity compared to lower-rate periods.
The market’s defensive posture was further compounded by external macroeconomic pressures, specifically elevated oil prices and persistent inflation concerns that threatened to derail yield stabilization. Despite these headwinds, the bond market found a critical floor at the 5.35% level for the 10-year yield, a threshold that analysts identified as essential for preventing a return to worst-case scenarios where rates could spike toward 8% or even 9%. This psychological and technical support allowed investors to pause their aggressive selling, creating a window of stability that directly translated into the slight dip in mortgage pricing observed last week.
While the immediate relief from the yield slip provided a temporary halt to the decline in housing demand, the underlying data suggests this is a fragile recovery rather than a sustained trend. Weekly pending sales data showed a brief positive print as rates fell toward 7.30%, but purchase applications remain soft because they have not yet fully accounted for the recent rate movements. The market remains bifurcated: while rates under 6.64% historically drive growth, the current environment above 7% continues to suppress activity, with purchase applications showing more negative week-to-week prints than positive ones in the first ten months of 2026.
The counterfactual analysis provided by market spreads highlights the severity of the situation had volatility not been managed. With mortgage spreads widening to 2.23% as a standard reaction to yield shifts, the actual rate of 7.33% stands in stark contrast to what would have occurred under worst-case spread conditions from previous years. Specifically, if spreads had remained at their 2023 peaks, rates would have hit 8.21%; however, the source does not provide figures for worst-case levels in 2024 or 2025. This spread mechanism effectively acted as a shock absorber, preventing the market from entering a deeper crisis while yields fluctuated near the 5% threshold.
Looking beyond immediate pricing, the stabilization in Treasury yields has created a unique dichotomy for different market participants. For prospective buyers, the pause offers a momentary reprieve from the fear of rates reaching double digits, yet the ‘new normal’ of high borrowing costs remains a barrier to entry. Conversely, for those still accumulating down payments, the higher yield environment presents an opportunity to lock in returns on savings through high-yield accounts or Treasury bills, which are currently offering between 3.5% and 5%. This allows savers to maintain purchasing power without the volatility of equities, though it requires a strategic decision on whether to commit funds to fixed-duration instruments like T-bills or keep liquidity flexible for potential price cuts in the housing market.
Federal Reserve Policy Signals and the Inflation Constraint
The Federal Reserve is expected not to hike rates in its upcoming announcement, according to market analysis. While a rate increase appears unlikely, volatility may still emerge from the specific language used in the policy statement or remarks made by Fed Chair Powell during the scheduled press conference. This dynamic suggests that future movements in mortgage rates will depend more on rhetorical signals than immediate changes to the federal funds rate.

Persistent inflation continues to exert pressure on the housing market despite recent stabilization in mortgage rates and Treasury yields. Although concerns regarding mortgage rates reaching 8% have subsided as yields pause in the 5% range, the underlying economic environment remains constrained by ongoing price pressures. This tension creates a scenario where rates remain elevated while the broader market waits for clearer signals on when inflationary forces will fully recede.
The current stability in bond markets has allowed mortgage rates to hold steady, yet this calm is fragile given the reliance on Fed communication. Investors are watching the conflict in Iran and waiting for fresh unemployment claims before making their next move, adding layers of complexity to how market participants interpret policy signals. As a result, the path forward involves navigating a landscape where rate levels are stable but the potential for sudden shifts remains tied to future rhetoric rather than confirmed actions.
Specific data from Freddie Mac indicates mortgage rates stood at 7.32% for the week ending October 22, marking a decline from 7.40% the prior week and reversing seven consecutive weeks of gains that had previously pushed rates to three-year highs. This stabilization follows a dip in the 10-year Treasury yield from 5.24% to approximately 5.13%, driven by investors adopting a defensive posture as they monitor the unfolding conflict in Iran and await fresh unemployment claims before adjusting their portfolios, contributing to the pause in mortgage rate increases.
The current market environment presents a dichotomy where high rates remain a significant pain for borrowers who previously benefited from extremely low interest rates, yet simultaneously offer an opportunity for savers to utilize cash more productively. Financial analysts note that prospective buyers with accumulated down payments can now park funds in money market accounts or high-yield savings vehicles offering returns between 3.5% and 5%, thereby preserving purchasing power without the volatility associated with equities.
While Treasury bills provide a secure avenue for saving with defined maturities of three, six, or twelve months backed by the full faith of the U.S. government, they introduce liquidity constraints that may hinder buyers who need immediate access to capital for opportunistic purchases. Consequently, experts suggest that high-yield savings accounts remain superior for those actively house hunting without a fixed timeline, whereas Treasury instruments are better suited for investors with known expenses within the next six months.
The fragility of this stability is underscored by the fact that bond markets have remained aligned for two consecutive days following last week’s improvement, yet the upcoming Fed announcement introduces an element of uncertainty where volatility may stem from rhetorical nuances rather than actual policy shifts. Market participants recognize that while a rate hike is highly improbable, the specific language in the policy statement or remarks by Chair Powell during the 2:30 pm ET press conference could trigger immediate reactions in mortgage pricing.
Demand Dynamics: The Thresholds That Define Buyer Behavior in 2026
Housing demand has demonstrated a clear sensitivity to specific interest rate thresholds, with data indicating that growth typically occurs when mortgage rates remain under 6.64%. Conversely, historical patterns show that rates exceeding 7% have consistently generated softer market data over the last three years and ten months. While buyers often prefer drastic rate reductions, stable conditions are viewed as more reliable for purchasing decisions than the volatility experienced earlier in the year.
The relationship between yield levels and buyer activity became evident when mortgage rates peaked around 7.60% before falling toward 7.30%, a movement that temporarily halted the decline in housing demand. This pause occurred during one of the bond market’s more volatile weeks, suggesting that even slight improvements from peak levels can stop the bleeding in weekly metrics. However, the data indicates that rates above 7% continue to suppress activity compared to periods when yields remain lower.
The 6.64% Tipping Point: When Demand Returns
Purchase application data provides a forward-looking perspective on these dynamics, showing significant softening as mortgage rates rose above the 6.64% mark. In the first part of 2026, weekly purchase applications recorded 23 negative prints compared to only 15 positive ones, reflecting the dampening effect of higher borrowing costs. This trend persisted despite some weeks where holiday events or weather conditions were the primary drivers of fluctuation.
Application Trends: The Net Negative Print of Early 2026
Recent figures show mortgage rates stood at 7.32% for the week ending October 22, down from 7.40% the prior week following seven consecutive weeks of gains. Although this dip represents a slight improvement, purchase applications have softened again as rates remain above the 7% threshold that historically correlates with weaker data. The current environment reflects a market where demand remains fragile until yields stabilize at levels conducive to growth.
The 2026 HousingWire forecast explicitly anticipated mortgage rates to oscillate between 5.75% and 6.75%, with the 10-year yield fluctuating within a range of 3.80% to 4.60%. These projections highlight the volatility that has characterized the market, where the actual peak of 7.60% significantly exceeded the upper bounds of the anticipated forecast before retreating toward 7.30%. The deviation from these expected ranges underscores the severity of the bond market’s recent turbulence, which temporarily halted the decline in housing demand only after rates retreated from their highs.
Historical data spanning the last three years and ten months confirms that while demand typically expands when mortgage rates remain under 6.64%, any rate exceeding 7% has consistently generated softer market metrics. This pattern held true even during weeks where external factors such as holiday events or weather conditions were primary drivers of fluctuation, indicating that borrowing costs remain the dominant variable in buyer behavior. The current environment reflects a fragile state where demand remains suppressed until yields stabilize at levels conducive to growth, with purchase applications softening again as rates hover above 7%.
Weekly pending sales data provides a week-to-week perspective on these dynamics, though results can be affected by holidays and short-term fluctuations that typically take 30-60 days to reflect in final sales figures. In the first part of 2026, weekly purchase applications recorded 23 negative prints compared to only 15 positive ones, reflecting the dampening effect of higher borrowing costs despite some weeks where holiday events or weather conditions were the primary drivers of fluctuation. The data indicates that rates above 7% continue to suppress activity compared to periods when yields remain lower, reinforcing the threshold nature of the 6.64% mark for demand growth. (Slightly lower mortgage rates finally pause slide in housing demand)
The Cost of Inaction: Borrower Behavior and Rate Optimization Failures
New Bankrate research indicates that 87% of American mortgage borrowers did not choose the most competitive rate available to them in 2025. This failure to secure optimal terms resulted in a specific financial burden, costing the typical borrower $3,343 annually.
The 87% Gap: The Financial Impact of Rate Shopping Failures
The data highlights that borrowers often accept initial offers rather than engaging in the necessary comparison shopping required to identify lower rates. While mortgage rates depend on individual finances and lender pricing strategies, experts note that even small differences can accumulate significantly over a 15-to-30-year loan term.
ARM vs. Fixed: Navigating the Current Rate Environment
Borrowers face distinct choices between products like the 30-year fixed rate and adjustable-rate mortgages, each carrying different interest rates and APRs as of late October 2026. The research suggests that failing to compare these options across multiple lenders can lead to paying more than necessary for a mortgage.
The specific financial burden of $3,343 annually translates to a staggering $78,186 over the typical life of a loan, according to Bankrate’s “Hidden Homeownership Tax” research. This cumulative loss is not isolated; it aggregates into an estimated $65 billion in annual costs across all mortgages originated since 2022. The data underscores that accepting the first offer without comparison acts as a significant tax on homeownership, particularly as rates climb and the cost of inaction rises proportionally.
As of late October 2026, the rate environment presents distinct product variations where even minor percentage differences yield substantial long-term costs. The table indicates a 30-year fixed rate at 7.31% with an APR of 7.38%, while a 5-year ARM option shows a rate of 5.875% and an APR of 6.530%. On a loan amount exceeding $832,750, terms may differ from those displayed, requiring direct confirmation with lenders. For instance, the 30-year fixed example lists upfront costs of $16,336 including 1.907 points, resulting in an 8-year total cost of $386,732, whereas a comparable ARM option shows upfront costs of $15,381 and an 8-year cost of $383,985.
Bankrate CEO Matt Fellowes notes that their marketplace facilitates real-time competition among hundreds of lenders, having returned $121 million to consumers in the current year alone. Experts emphasize that rates vary significantly between lenders on the same day based on individual finances and pricing strategies, making it crucial for borrowers to compare at least three offers. Without this diligence, borrowers risk paying more than necessary, as the rate secured from one lender may be substantially different from another despite identical credit profiles. (Current Mortgage Rates: Compare Today’s Rates | Bankrate)